Every reward comes from a confirmed block.
There is no reserve, no PPS smoothing, no IOU queue. When a block matures, that block's reward funds the allocation for the work that contributed to it. Conservation is enforced exactly, per block.
How rewards work
Every reward allocation is funded by a real block — and weighted by what your shares were actually worth. No reserves. No round cliffs. No hopping advantage.
icemining uses Kernel-PPLNS — a no-reserve revenue-share model built on Rosenfeld's unit-based framework. Three properties matter most.
There is no reserve, no PPS smoothing, no IOU queue. When a block matures, that block's reward funds the allocation for the work that contributed to it. Conservation is enforced exactly, per block.
Your share takes up window space proportional to your assigned difficulty divided by the live network difficulty. A difficulty-1000 share carries 1000× the weight of a difficulty-1 share. Vardiff doesn't distort what you earn.
Shares are weighted with a smooth, normalized truncated-exponential kernel — the work closest to the block earns the most, older work fades gracefully. No abrupt drop when you join, no abrupt drop when you leave.
1. Share work units. Each accepted share contributes work units based on the difficulty the pool assigned to it and the live network difficulty at the moment of acceptance.
where s_i is the assigned share difficulty, D_i is the network difficulty at acceptance, and q_i is an optional reward-eligibility factor.
2. Window sizing. The window covers the last L expected blocks of work, chosen so that the probability of seeing at least one block in the window meets a target coverage:
With target_coverage = 0.999, this gives N_cov ≈ 6.908 expected blocks of window width.
3. Truncated-exponential kernel. The production kernel — newer work counts more, with a smooth tail that fades to zero at L:
The denominator 1 − e^(−L/τ) is the normalization constant that keeps the kernel a proper probability density. Production ratio: L = 4τ.
4. Per-block conservation. Every block's reward allocations come from that block's confirmed reward, with conservation enforced exactly:
The right-hand side is the actual confirmed block reward for block b. The left-hand side sums all per-share miner allocations miner_i, the per-share pool fee fee_i, and any remaining dust. Normal non-empty allocations redistribute remainder atoms before this check, so dust is zero and the two sides are equal — bit-exact.
Common PPLNS variants often become unfair when block rewards, network difficulty, pool hashrate, or vardiff change unless they account for share difficulty and define the window in work units. Kernel-PPLNS makes that unit explicit: expected blocks of accepted work.
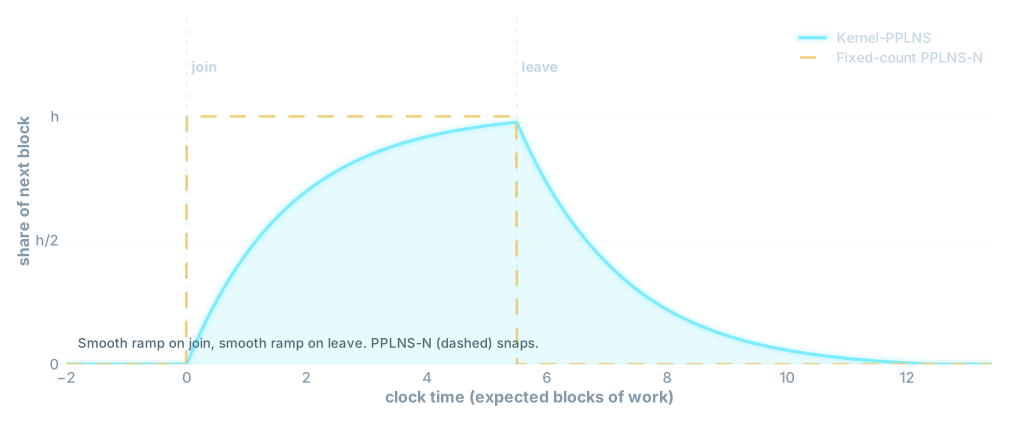
When a miner joins, their share of the next block grows smoothly as their work fills the kernel window. When they leave, their share fades the same way. Fixed-count PPLNS-N steps in a single jolt; Kernel-PPLNS curves.
Chart 01 · Ramp behavior
The cyan curve is Kernel-PPLNS. The dashed amber line is fixed-count PPLNS-N. Same hashrate, same time in pool — but the smooth kernel spreads the transition over the window length L instead of snapping. No cliff at join, no cliff at leave.
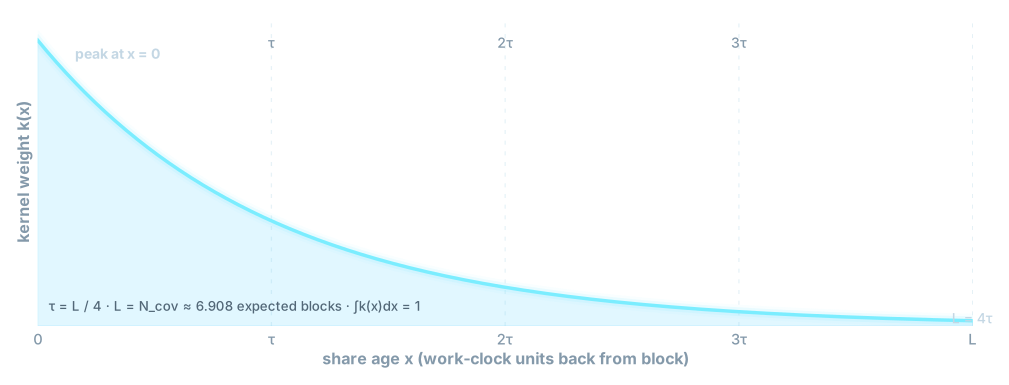
Each share inside the window earns weight from a smooth, normalized truncated-exponential kernel. Work close to the block earns the most; older work fades gracefully toward the tail at L.
Chart 02 · Kernel shape
The cyan curve is the production kernel kτ,L(x). Roughly 63% of the kernel mass sits inside the first τ of work — meaning the most recent block-time of work earns the bulk of the reward. At L = 4τ the remaining weight is only about 1.8% of the peak, then the bounded-support kernel cuts to zero.
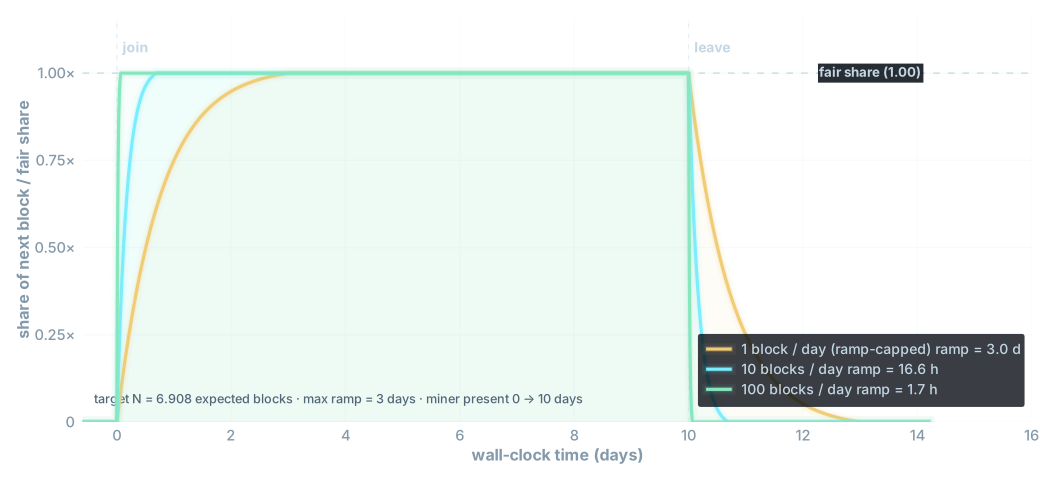
The target coverage window is measured in expected blocks of work, but slow reward scopes should not force week-long ramps. A published wall-clock cap reduces L when cadence is low, trading some coverage for faster, transparent convergence.
Chart 03 · Ramp time vs pool block rate
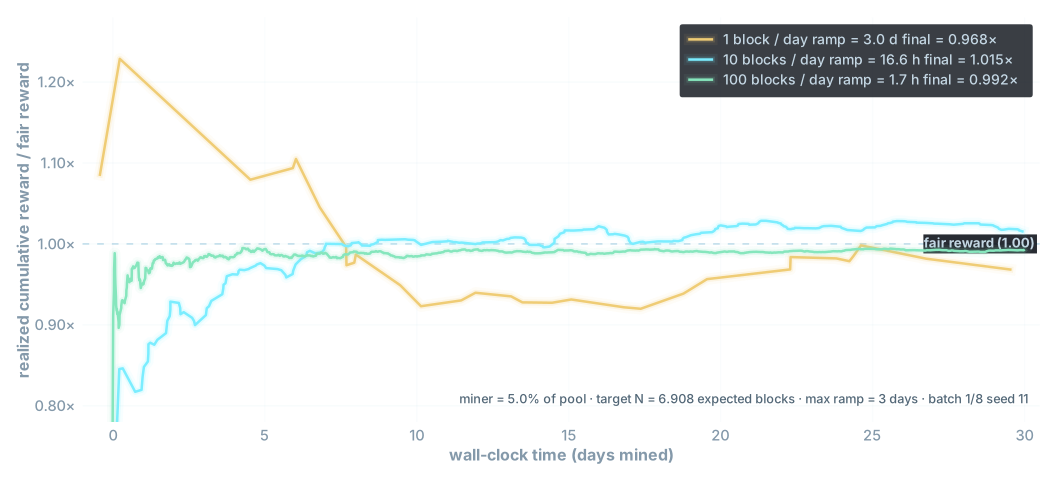
A single miner joins at day 0 and leaves at day 10. The target is 99.9% coverage (N ≈ 6.9 expected blocks), but the published max ramp is 3 days. A 1-block/day scope is therefore capped at L = 3.0, giving about 95% effective coverage and a 3-day full-tail ramp. Faster scopes keep the full target: 10 blocks/day ramps in 16.6 hours, and 100 blocks/day in 1.7 hours. This is the fair tradeoff: shorter ramp, higher variance, disclosed up front. The cap is a fixed public policy, not a round-timing signal.
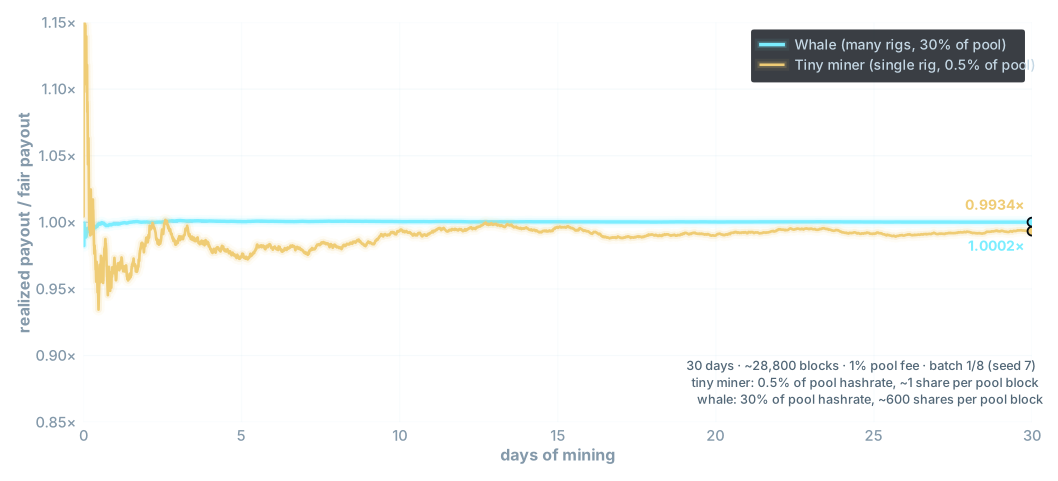
Two miners with very different scales — a single small rig and a whale running many — and very different assigned share difficulties. Simulated head-to-head, both end up at the same fair reward per unit of work. The whale's curve is nearly flat from day one; the small miner's wobbles, then converges.
Chart 04 · Fairness
Both lines converge to 1.00 — exactly the fair reward. Each seed batch is one independent 30-day Monte Carlo run. The whale stays essentially flat from day one; the tiny miner may finish a little above or below fair, which is normal variance over 28,800 pool blocks.
The tiny miner wobbles more during week one because they have only a handful of shares inside the kernel window at any moment, so each block's small reward allocation is bumpier. The whale has thousands of shares in-window so each block's reward allocation is essentially deterministic. Both effects average out over thousands of blocks — and crucially, both miners converge to the same expected reward per unit of work, regardless of scale or share difficulty.
Same three pool block rates, same ramp cap, same kernel policy — now with a real miner running through a Monte Carlo simulation. The expected reward is identical at every rate; what changes is how long it takes the realized line to look like the expectation.
Chart 05 · Realized rewards vs pool block rate
All three lines target 1.00× fair in expectation — Kernel-PPLNS credits the same expected rate regardless of pool cadence. The miner earns a smooth fraction of every block via the kernel; what changes between pools is how many blocks the pool finds during the window. Over 30 days that's ~30 pool blocks on a 1-block/day chain (few events to average over — the line still moves visibly), ~300 on a 10-block/day chain (settles near fair over the month), and ~3,000 on a 100-block/day chain (effectively flat from hour two). The same wobble applies whether you're 1% or 25% of the pool — bumpiness is set by event count, not your hashrate. Slow chains mean fewer pool blocks per month; fast chains mean smoother realized rewards. Plan for the cadence you're mining.
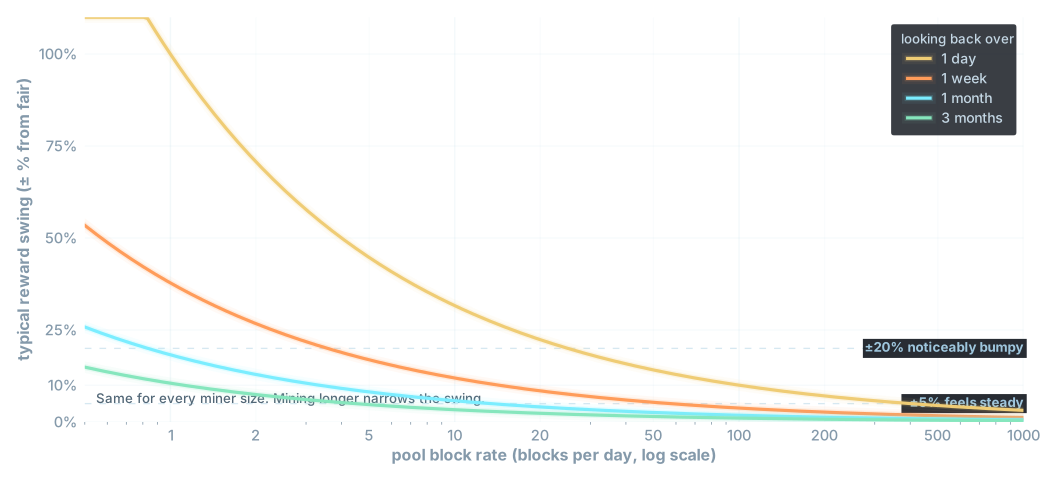
Variance is what you actually feel — "is this month within 5% of fair, or 50%?" In a kernel-PPLNS pool, variance comes from the random count of pool blocks during your observation window. Faster pool = more blocks = smoother rewards. The same for any miner size, since you receive a smooth fraction of every block instead of all-or-nothing.
Chart 06 · Variance vs pool block rate
"Typical swing" plotted on the chart is one standard deviation of cumulative reward expressed as a percent of fair. About two out of three observation windows land inside ± that swing.
Let r be the pool block rate (blocks per day), T the observation window (days), h the miner's hashrate fraction of the pool, and R the block reward. The number of pool blocks N in the window is Poisson-distributed:
In Kernel-PPLNS, each block credits the miner a smooth fraction h of the reward — the kernel averages over many in-window shares, so each block's allocation is close to deterministic. Cumulative reward over N blocks is therefore:
All randomness in P comes from the random count N. For a Poisson, mean and variance both equal T·r, so:
The chart's curves are the coefficient of variation — standard deviation divided by mean, then expressed as a percent:
Notice h cancels out: the swing is the same for every miner, regardless of hashrate fraction. That's because Kernel-PPLNS credits a smooth fraction of every block — there's no all-or-nothing block luck per miner, only across the pool as a whole.
Verified empirically by Monte Carlo (60 trials per row, with explicit Poisson block-count sampling, 5%-of-pool miner). Measured swing matches the analytical formula within ~20% — Kernel-PPLNS is slightly smoother than the pure-Poisson approximation because per-block share-count averaging reduces variance further:
| pool rate | window | analytic | measured |
|---|---|---|---|
| 1 / day | 30 days | 18.3% | 16.1% |
| 10 / day | 30 days | 5.8% | 4.9% |
| 100 / day | 30 days | 1.8% | 1.9% |
| 10 / day | 7 days | 12.0% | 9.7% |

Each curve shows the typical swing in your reward vs fair — about two out of three months will land inside that ± band, half over and half under. On a 100-block/day pool, a typical month is within ±2% of fair — reward flow is rock steady. On a 1-block/day chain it's ±18%, so some months you'll come in well over fair and some well under (it averages out, but month-to-month is bumpy).
Two practical takeaways: (1) the swing is the same whether you're 1% or 25% of the pool — every miner gets a smooth fraction of every block, so size doesn't change your variance; and (2) mining longer always smooths things out — three months on a 10-block/day pool feels as steady as one month on a 100-block/day pool.
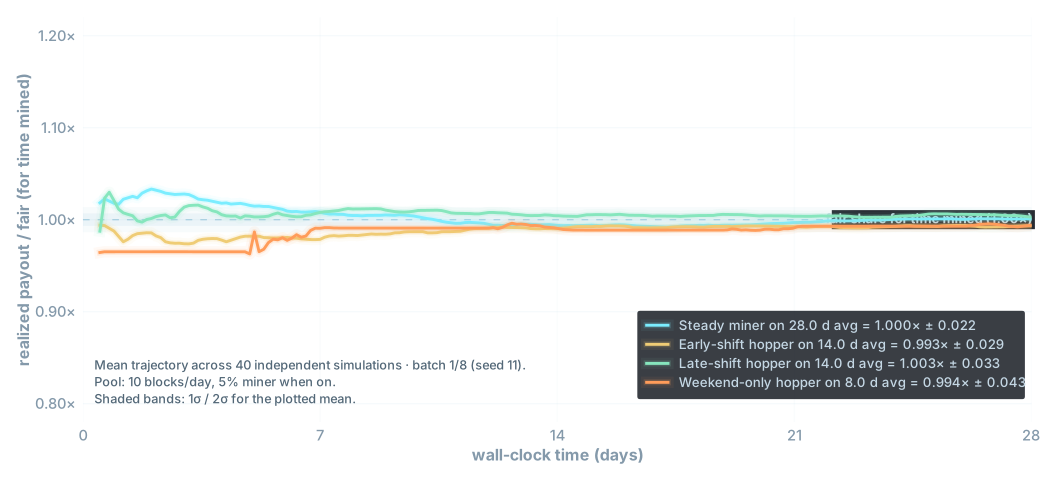
Comparing a hopper to a full-time miner is unfair: the hopper mined less, so of course they earned less. The honest test is each miner's realized reward divided by what they should earn given the hours they actually mined. In Kernel-PPLNS that ratio should land near 1.00 for fixed schedules — no visible systematic edge for ordinary on/off hopping.
Chart 07 · Hopping resistance
Four miners with the same 5%-of-pool hashrate when present, but very different schedules: a steady miner (28 days), early-shift hopper (mornings only, 14 days), late-shift hopper (evenings only, 14 days), and a weekend-only hopper (8 days). Each line is the average of 40 independent simulations — a single seed shows ±10% noise from block luck (see Chart 06), so we average across many to isolate the hopping effect from variance.
Across 8 independent pre-rendered seed batches (try the Next seed batch button above), every schedule's mean lands within about 1% of fair — no systematic edge for any hopping pattern. The simulation runs from steady-state prehistory and backfills the aggregate background when a hopper is off, so the pool's expected hashrate stays constant. Fair is computed as the kernel-weighted expected payout given each miner's actual on/off schedule, so ramp-tail rewards are attributed to the right shift.
Per-trial spread differs by schedule — the weekend hopper shows ±4% per single batch vs ±2% for steady — exactly as Chart 06's variance formula predicts: fewer mining days equals fewer pool blocks to average over. That's not a hopping penalty; it's the same luck-variance every miner faces. Fixed schedules do not show a systematic payout edge here.
Let a(t) be a fixed on/off schedule: 1 while the miner is submitting shares, 0 while away. For a block at wall time t, the kernel-weighted active fraction is:
Here r is the pool block rate in blocks per day, u is age in expected-block work units, and k(u) is the normalized payout kernel.
In the continuous-hashrate limit, a miner with on-time hashrate fraction h contributes expected kernel mass hA(t). If the background fills the missing hashrate when the hopper is off, total expected kernel mass remains 1, so the fair per-block share is:
The subtle part is that the simulator uses finite Poisson shares, and actual payout uses a ratio. In general, E[g/G] is not exactly E[g]/E[G]. The audit mode estimates the nonlinear ratio directly:
| schedule | audit ratio | kernel active | interpretation |
|---|---|---|---|
| steady | 0.999506 | 0.999997 | no premium |
| early | 0.999560 | 0.500307 | no premium |
| late | 0.999506 | 0.499690 | no premium |
| weekend | 0.999427 | 0.283923 | no premium |
Reproduce with uv run scripts/reward_graphs/hopping.py --audit --audit-samples 100000 --audit-bins 512. Ratios are slightly below 1 because finite share granularity leaves a small denominator effect; the important result is that early shift is not above late shift in the direct E[g/G] audit.
The shaded zone on the chart is for the plotted mean of 40 simulations, not for one simulation. For schedule j in a seed batch:
The 2σ band is twice that value. This is why the shaded zone is much narrower than the legend's ±SD number: the legend shows one-trial spread, while the plotted line averages 40 independent trials.
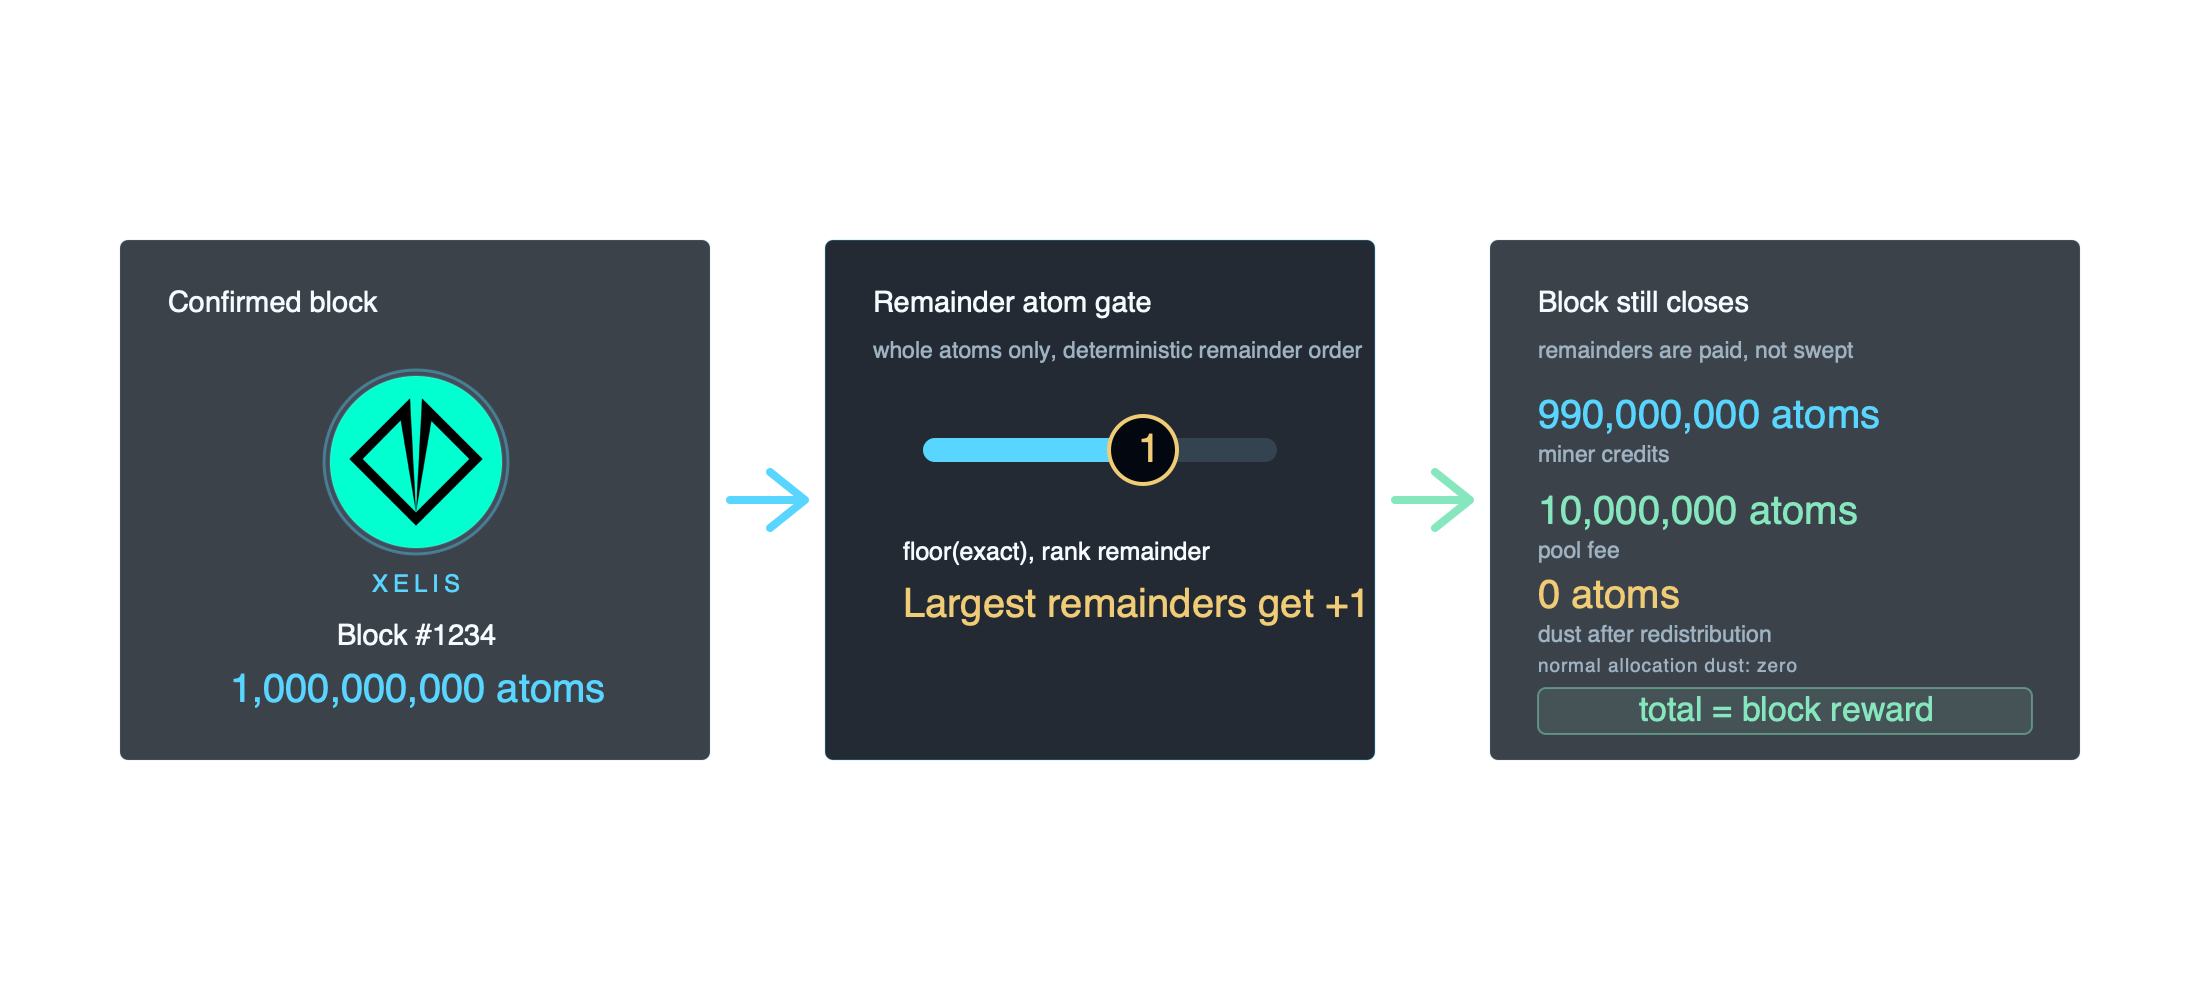
Per-block conservation is enforced exactly: miner reward allocations plus the pool fee plus any remaining dust equals the actual matured block reward. Remainder atoms are assigned before closure, so normal allocation dust is zero.
Chart 08 · Block-funded conservation

The allocator computes each payout key's floored gross and fee amounts plus their exact integer remainders. It then pays the missing whole atoms by deterministic largest-remainder order before the final conservation check. A successful non-empty allocation distributes the full daemon-credited reward, so normal dust is zero.
/// Allocation result for one block. Conservation MUST hold:
/// `Σ miner_atomic + Σ fee_atomic + dust_atomic == actual_reward_atomic`.
pub struct BlockAllocation {
pub dust_atomic: u128,
pub total_miner_atomic: u128,
pub total_fee_atomic: u128,
}
// For every payout key K, before integer-atom flooring:
//
// exact_gross_K = actual_reward_atomic * G_K / G_b
// exact_fee_K = actual_reward_atomic * F_K / (G_b * 10_000)
//
// The helper returns floor(exact) and the exact U256 remainder in one
// stack-only U512/U256 division. The remainder is the payout ranking key.
//
for (key, agg) in per_key {
let (gross_atomic_u256, gross_remainder) =
u256_mul_div_floor_rem(&reward_atomic_u256, &agg.g_k_q128, &g_b)?;
let gross_atomic = u256_to_u128_saturating(&gross_atomic_u256);
let (fee_atomic_u256, fee_remainder) =
u256_mul_div_floor_rem(&reward_atomic_u256, &agg.f_k_q128, &denom_g_b_times_10000)?;
let fee_atomic = u256_to_u128_saturating(&fee_atomic_u256);
payouts.push(SettlementScratch {
key,
gross_atomic,
fee_atomic,
gross_remainder,
fee_remainder,
gross_incremented: false,
});
}
// Floor residuals are whole atoms still owed by this block:
//
// actual_reward_atomic == Σ floor(exact_gross_K) + gross_residual
// 0 <= gross_residual < payout_key_count
//
// With 10,000 payout keys there can be up to 9,999 residual atoms, but
// they are paid out here, not left as block dust.
let fee_residual = fee_target - total_fee_floor;
distribute_fee_remainder(&mut payouts, fee_residual);
let gross_residual = actual_reward_atomic - total_gross_floor;
distribute_gross_remainder(&mut payouts, gross_residual);
// After redistribution, each key's miner+fee equals its final gross.
for p in payouts {
if p.fee_atomic > p.gross_atomic {
return Err(AllocatorError::ConservationViolated {
got: p.fee_atomic,
expected: p.gross_atomic,
});
}
let miner_atomic = p.gross_atomic - p.fee_atomic;
total_miner = total_miner.saturating_add(miner_atomic);
total_fee = total_fee.saturating_add(p.fee_atomic);
}
let distributed = total_miner.saturating_add(total_fee);
if distributed != actual_reward_atomic {
return Err(AllocatorError::ConservationViolated {
got: distributed,
expected: actual_reward_atomic,
});
}
// What this guarantees:
//
// Σ miner_atomic + Σ fee_atomic == actual_reward_atomic
// dust_atomic == 0
//
// The residual bound still scales with payout-key count, but residual
// atoms are deterministically assigned instead of being swept as dust.
let dust_atomic = 0;One confirmed block, expanded as an atom-level ledger. The matured block reward is exactly 1,000,000,000 atoms: miner reward allocations (cyan, 990,000,000 atoms) plus the 1% pool fee (green, 10,000,000 atoms). Deterministic largest-remainder rounding pays the whole residual atoms to payout keys, so normal allocation dust is 0 atoms. The closure error is 0 atoms, bit-exact.
The important distinction is residual versus dust. With 10,000 distinct payout keys, the initial gross floors can leave as many as 9,999 whole atoms unresolved. This allocator does not leave those atoms in dust: it ranks the exact remainders and assigns each residual atom once, then requires the final distributed total to equal the daemon-credited reward exactly.
The most common reward-accounting attacks against fixed-window PPLNS variants are eliminated by Kernel-PPLNS by design — not by policy or monitoring, but by the math.
The window is measured in work units, not rounds, and never resets. Coming and going just means you stop earning new weight while you're away — no penalty, no advantage.
Reward accounting uses the share difficulty the pool assigned before work was issued — not the difficulty actually achieved. Posterior tweaks earn nothing.
The reward cutoff is frozen at the moment the block-finding job was issued — not when it was received. Padding with late shares is impossible.
Each share carries its work units from the moment of acceptance. After-the-fact difficulty inflation is rejected outright.
Block-funded rewards. A work-measured window. A smooth kernel that credits the work you do — no cliff when you arrive, no penalty when you leave.
Get started